
This is a free physical verification report format in Excel — six sheets covering field capture, FAR reconciliation, variance summary, an audit checklist and the structure of the report itself. No email required, nothing to sign up for.
Most physical verification exercises produce a list of observations that never make it back into the books. Someone walks the floor, notes what is missing, and the note sits in a folder while the Fixed Asset Register carries on saying something different. This format is built to close that gap..
Version 1.0 · Last updated 30 July 2026 · Free to use, adapt and share
What is inside the workbook
Six sheets, worked in sequence. The checklist opens at the planning stage, the observation sheet is filled at site, and everything after that is calculated from what you enter.
1. How to Use
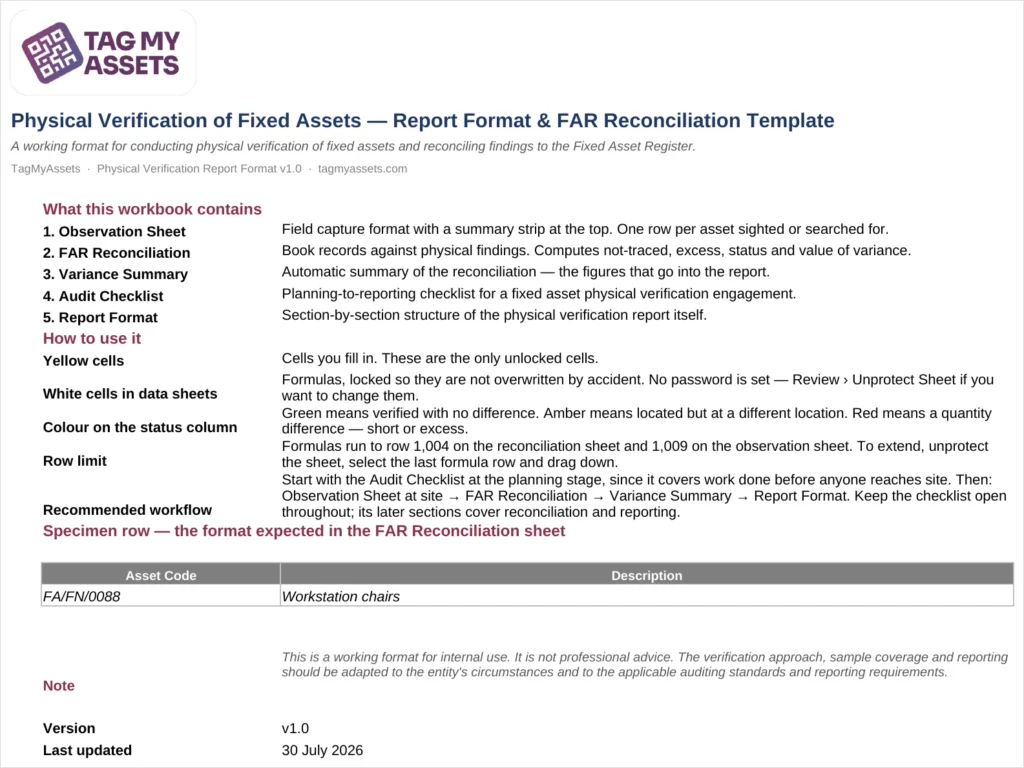
Every sheet is documented before you open it. The workbook tells you which cells to fill, which are formulas, what the colours on the status column mean, and the order the sheets are meant to be worked in. A specimen row shows the format expected in the reconciliation sheet.
2. Audit Checklist
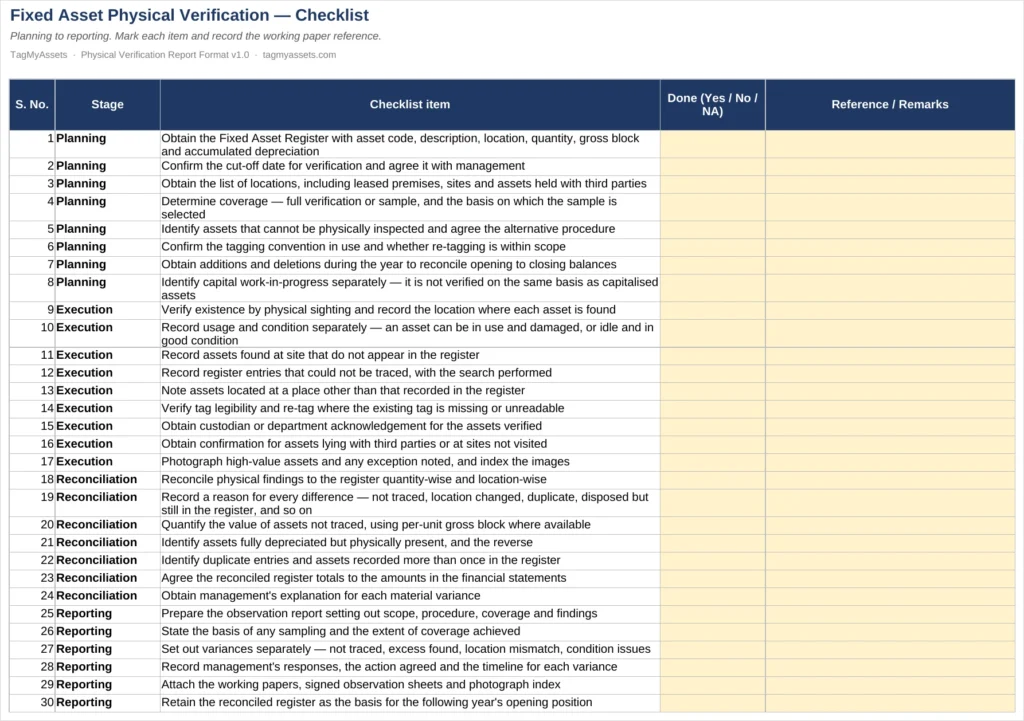
Thirty items across planning, execution, reconciliation and reporting. Cut-off date, coverage basis, the list of locations including assets held with third parties, capital work-in-progress kept separate, custodian acknowledgements, management responses. Each item carries a status and a working paper reference, so the checklist doubles as an index to the file.
3. Observation Sheet
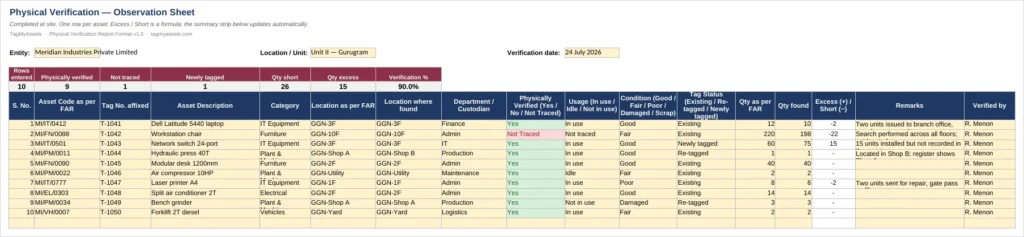
The field capture format. One row per asset, recording the asset code, the tag affixed, the location where it was actually found, and the quantity against what the register says. Usage and condition are separate columns, because an asset can be in use and damaged, or idle and in perfect condition — collapsing the two loses information the report needs.
The strip across the top updates as you type: rows entered, physically verified, not traced, newly tagged, quantity short, quantity in excess, and the verification percentage. Useful when a team is working several locations and someone needs to know where the count stands.
4. FAR Reconciliation
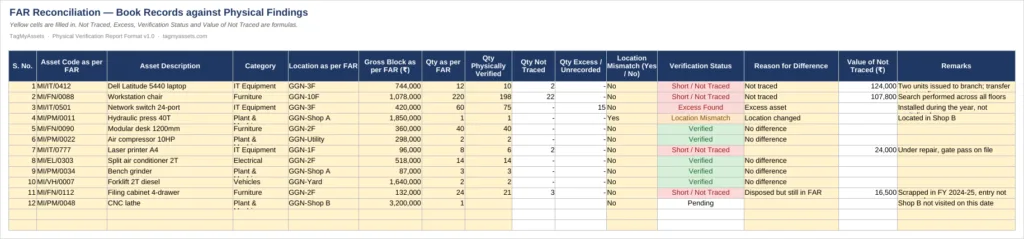
Book records against physical findings. Enter the register quantity and the quantity verified, and the sheet computes the quantity not traced, the quantity found in excess, the verification status, and the value of the not-traced quantity using per-unit gross block.
The status column is colour-coded — green where there is no difference, amber where the asset was located but at a different place, red where the quantities do not agree. A separate column records why each difference arose: not traced, location changed, duplicate record, disposed but still in the register, under installation, under repair. The difference and the reason for it are two different things, and the report needs both.
5. Variance Summary
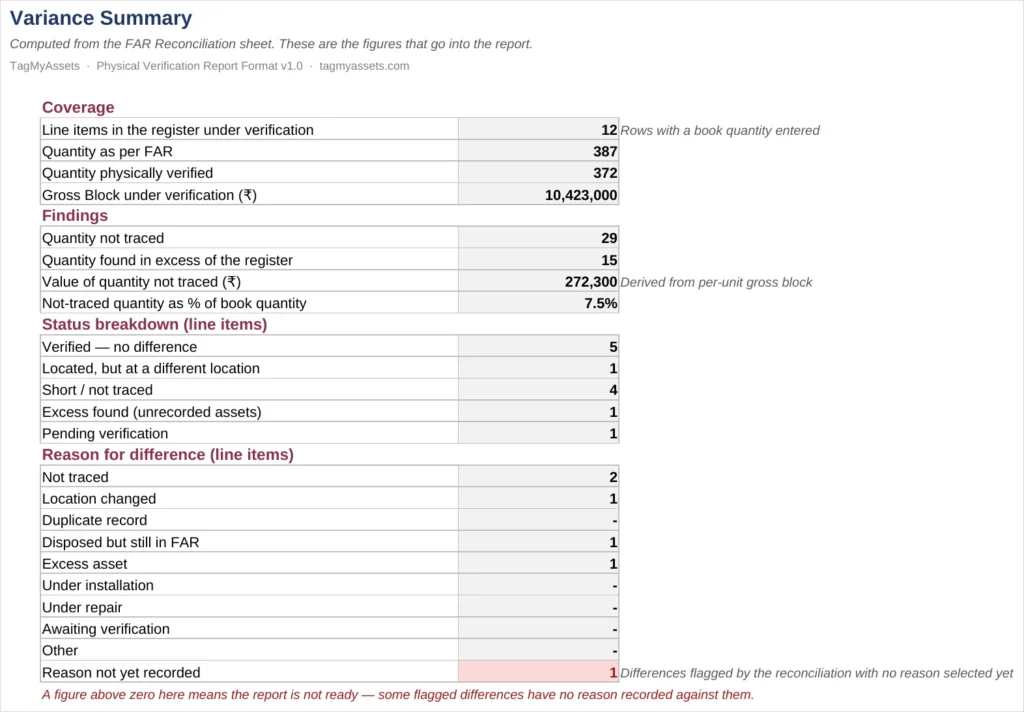
The figures that go into the report, computed from the reconciliation. Coverage, quantity not traced, quantity in excess, the value of the not-traced quantity, the status breakdown, and a count of differences grouped by reason.
The last line is a completeness check. It counts differences the reconciliation has flagged where nobody has yet recorded a reason, and turns red when that number is above zero. A report should not leave the building while that cell is red.
6. Report Format
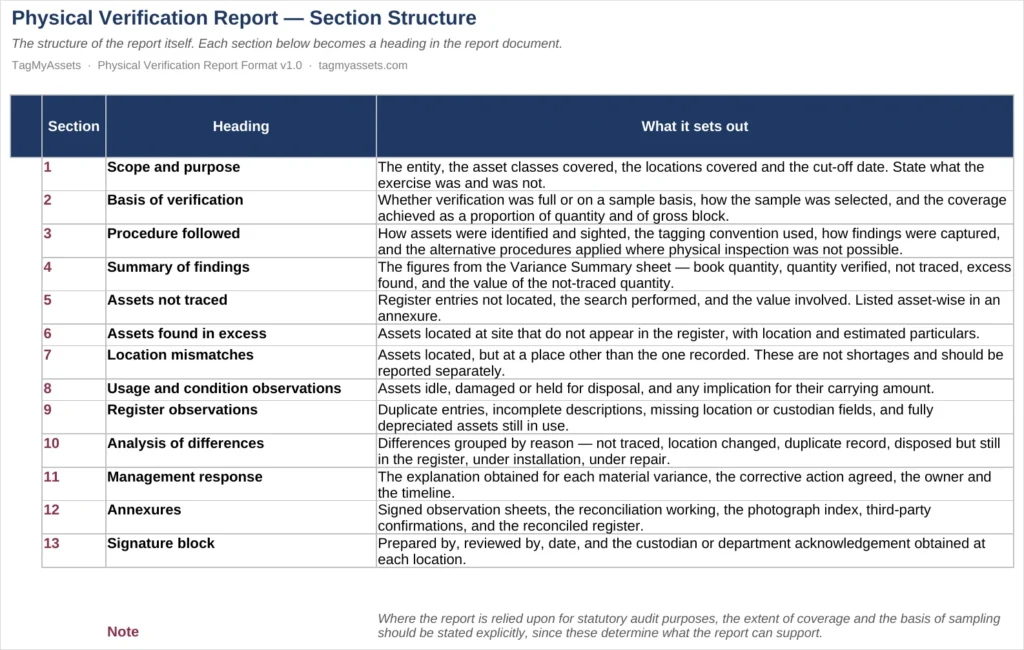
Thirteen sections setting out how the report itself is structured — scope and purpose, basis of verification and coverage achieved, procedure followed, summary of findings, assets not traced, assets found in excess, location mismatches, usage and condition observations, register observations, analysis of differences by reason, management response, annexures, and the signature block.
What the workbook does for you
- Calculates not-traced and excess quantities from the figures you enter
- Assigns a verification status to every line and colour-codes it
- Values the not-traced quantity using per-unit gross block
- Keeps the difference and the reason for it in separate columns
- Flags differences with no reason recorded, before the report goes out
- Locks the formula cells so they are not overwritten — no password, so you can still adapt it
- Runs to 1,000 asset rows and prints on standard paper
When the reconciliation actually happens
Most people picture a verification exercise as three steps in sequence: count everything, reconcile it against the register, then write the report. In practice that order does not work, and this workbook is built on the assumption that it will not be followed.
Records come off the floor every day the team is on site. They should be checked the same day. A category that does not match the asset, a location code that is not in the master, a mandatory serial number left blank, the same asset counted twice from two directions — none of these announce themselves, and all of them are cheap to fix while the team is still standing in the building.
The cost of an error is not fixed. It changes with when you find it. A difference picked up on day three takes one message to the site supervisor. The same difference found after demobilisation means contacting a custodian who no longer remembers, working from a photograph that may not answer the question, or accepting that the gap cannot be closed.
Two features of this workbook exist for that reason. The summary strip on the observation sheet updates as rows are entered, so anyone can see where the count stands while it is still running rather than at the end. And the completeness check on the variance summary turns red while any flagged difference has no reason recorded against it — so unexplained differences surface before the team leaves, not after the report has been circulated.
A difference found on day three is a question. The same difference found on day thirty is an audit observation.
When to use it
Annual physical verification ahead of the statutory audit. Verification of a newly acquired unit, or a location being taken over. A one-off count where the register has drifted from what is actually on the floor. A cycle count of high-value or movable assets during the year.
It is built for fixed assets — property, plant and equipment. Inventory verification works on a different unit of measure, different cut-off considerations and different valuation treatment, so the columns here will not fit it well without changes.
Frequently asked questions
What is a physical verification report?
A physical verification report records the result of physically inspecting an organisation’s fixed assets and comparing what was found against the Fixed Asset Register. It sets out the scope and cut-off date, the basis on which assets were selected, the procedure followed, and the differences identified — assets not traced, assets found that are not recorded, and assets located somewhere other than the register shows.
What should a physical verification report contain?
At a minimum: scope and purpose, the basis of verification and coverage achieved, the procedure followed, a summary of findings, the differences set out separately by type, an analysis of why each difference arose, management’s response and the action agreed, and the supporting annexures. The Report Format sheet in the workbook sets out all thirteen sections.
What is the difference between physical verification and FAR reconciliation?
Physical verification is the field activity — going to site and establishing what exists. FAR reconciliation is the desk activity that follows — matching those findings back to the register and quantifying the differences. Verification without reconciliation produces a list of observations that the books never absorb.
How should differences found during physical verification be recorded?
Record the difference and the reason for it separately. A quantity that does not agree is the difference. Whether it arose because the asset was not traced, had been shifted, was disposed of but never removed from the register, is under installation or under repair, or is a duplicate record, is the reason. The workbook keeps these in two columns because the report needs both.
Does CARO 2020 require physical verification of fixed assets?
CARO 2020 requires the auditor to report on whether the company has a programme of physical verification of property, plant and equipment at reasonable intervals, whether that programme is appropriate having regard to the size of the company and the nature of its assets, and whether any material discrepancies were noticed and properly dealt with in the books of account. The obligation to carry out the verification sits with management; the auditor reports on it.
Can this format be used for inventory verification?
It is built for fixed assets. Inventory verification uses a different unit of measure, different cut-off considerations and different valuation treatment, so the columns here will not fit it well without changes.
How many assets can the workbook handle?
Formulas run to 1,000 rows on the reconciliation sheet and just over 1,000 on the observation sheet. To go further, unprotect the sheet, select the last row of formulas and drag down.
Is the file free to use and share?
Yes. There is no email requirement and no password on the sheets. It can be used internally, shared with colleagues, and adapted to your own working papers.
Related resources
Physical verification of assets — how a verification engagement is scoped and run.
FAR reconciliation process — what happens to the findings once verification is complete.
CARO 2020 and fixed asset verification — the reporting requirement and the evidence it relies on.
Asset tagging in India — tagging conventions, technologies and process.
What we found verifying assets across India — observations from the field.
Institute of Chartered Accountants of India
Running verification across several locations?
We carry out fixed asset tagging, physical verification and FAR reconciliation as a field service across India. If the exercise is larger than your team can absorb, tell us the asset count, the locations, and whether the register is current — we will come back with a scope and an estimate.